
A month ago the agents were set loose: the work went to the Datarim framework, Coworker spreads the load across model providers, and the agents themselves write code, close tasks, migrate databases and move to new servers — 340 tasks closed in the second month (the overall picture and the dynamics are in the first article of the cycle). All of it runs without manual steering. But there is a blind spot: what the agents are doing right now is almost impossible to see from the outside.
Which raises an awkward question: if the ecosystem is autonomous, why watch it at all? Because autonomy on its own guarantees nothing — you need numbers that show whether the work is moving or stuck. Steering is handed to the agents; watching stays with the human. The point isn't to control every step, it's to see what's going on without poking the agents every five minutes.
The idea came from a post by Sergey Pimenov about visualizing agents — he put workflow metrics on a big screen. For now the agents' work runs almost blind: the result shows up in the git log and in the Munera task tracker, but the movement across the task graph does not. Which projects are active, where the bottleneck is — you're left to guess.
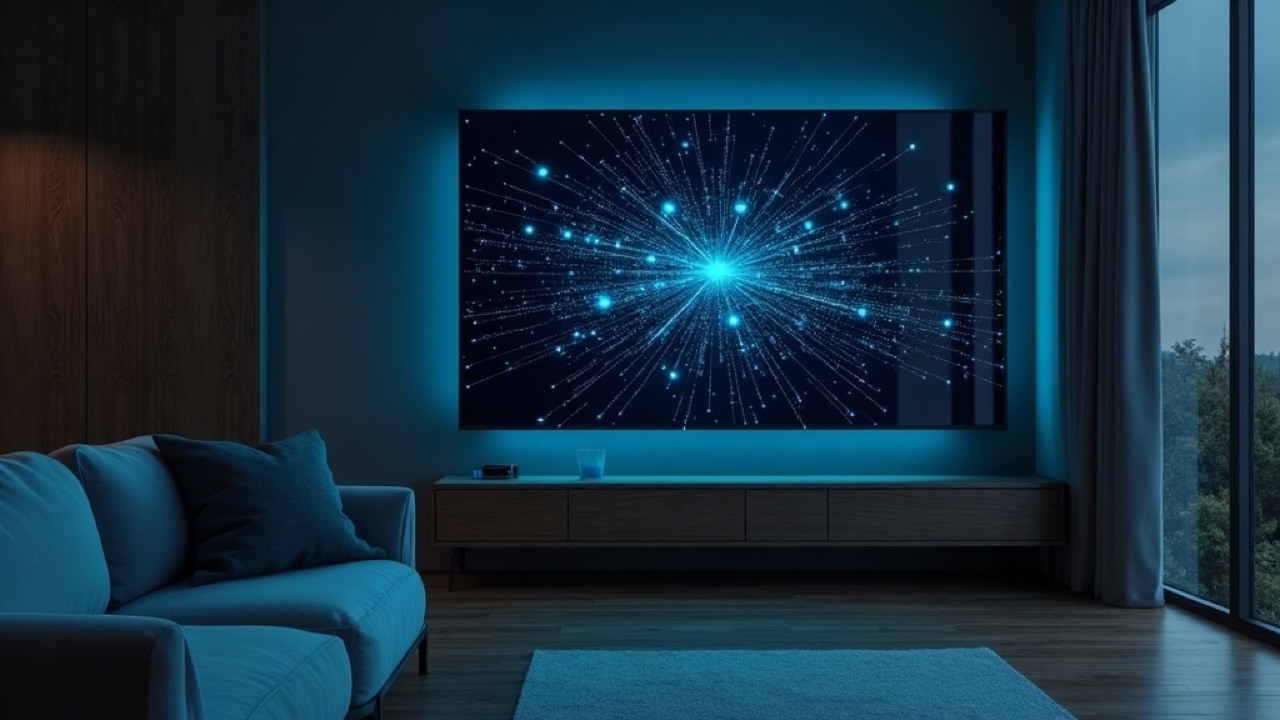
There's an ordinary Android TV at home: YouTube and streaming, nothing more. The plan is to get root access and install a separate Android app built for the TV (an APK), not an open browser tab. The app will keep the agent graph on the screen and show the same data the agents see: 26 active projects, 340 tasks closed over the last month, 85 tasks on the Datarim framework, 37 on infrastructure, 22 on the status dashboard.
What goes into the 22 dashboard tasks
Of the 340 tasks in the second month, 22 are on the status dashboard itself. The project is new, born in this same cycle. It has one job: put the agents' work on a screen so the picture reads at a glance.
What those 22 tasks are meant to cover:
- A graph of active tasks — which projects are in progress, what complexity (L1-L4), which agents are busy.
- Closing pace — how many tasks closed over the past week, broken down by day.
- Token economics — Coworker statistics on output tokens and cost. In the snapshot for the 30 days up to mid-June, when this article was written: 1,578 calls, 5.4 million output tokens, $15.18 on cheap models.
- Infrastructure health — the fleet of servers, certificates, deploy status (the move from virtual machines to bare metal is a separate article).
The graph's visual language is meant to be simple. Node color is complexity: L1-L2 muted, L3-L4 bright, so the heavy tasks catch the eye first. Node size is how many subtasks hang off an epic. Edge thickness is how often tasks reach for each other through the shared knowledge base. A branch with no commits for a while slowly fades: the longer the silence, the paler the node. A stalled area dims against the working ones and is visible across the room.
You'll be able to glance at the dashboard in passing — not to police every step, but to feel the rhythm. The graph freezes — time to check the Coworker log or the orchestrator. A branch grows too dense — an agent has settled on one project, time to shift focus.
Where the data comes from
On its own the dashboard knows nothing — it feeds from Munera, a task tracker built for AI agents. Munera has three traits that make it more than a to-do list.
The first is memory. Every closed task stores not just a title and status but the context: which files changed, which decisions were made, which skills were needed. The result is not a flat list but a shared knowledge base the agents return to through Scrutator's vector search (how shared memory ties the agents together is covered in a separate article).
The second is the dependency graph. Tasks don't hang in a vacuum; each one references others. L4 epics (22 of them in the second period) pull chains of L3 and L2 tasks behind them. The visualization on the TV should show this web: which tasks haven't started, which are waiting on others.
The third is token economics. Coworker spreads the load across Claude, Kimi, DeepSeek and OpenRouter, and Munera records how much each task consumed. The dashboard will show not a dry "archive #123 closed" but "this task cost $0.03 on Coworker plus $0.47 on Claude."
Technically the app is meant to stay modest. A native Android client installed on the TV and open on a single screen. Every few minutes it polls Munera over the local network and redraws the graph — no animations, no pop-ups, so the picture doesn't flicker in the corner of the room. No separate server is needed: the data is the same the agents see, just drawn large. Most of the 22 tasks will go not into graphics but into a careful selection from Munera — so the screen doesn't flatter the state or show as closed what is still in progress.
The goal is to tell whether the agents are working efficiently without opening a console.
What should change
From the graph on the TV we expect three changes.
First — the terminal won't have to be opened every fifteen minutes. Right now checks are manual: the git log, Coworker statistics, the list of recent commits. With the graph on the screen a quick look is enough — the task-closing pace is visible at once.
Second — stalls should surface sooner. The graph shows not only what the agents did but also what they didn't. A branch that hasn't grown for more than a day is worth a closer look. Say an agent loops on a heavy migration epic because of a network failure at a model provider: without visualization that comes out two or three days later, but on the graph — the same day.
Third — intervention should be rarer. It sounds backwards, but it is precisely a constantly visible graph that removes the urge to step in. When you can see the agents working — the graph grows, the metrics climb, tasks close — there's no reason to intervene. Right now the agents' work has to be judged by feel, which makes you check one more time than needed; the screen takes that anxiety away.
Why a TV specifically
The objection is obvious: why a TV, if the same dashboard opens on a laptop or a phone? The difference is between "have to open" and "already in view."
A dashboard you have to open demands a decision: check now or later. Usually later. And "later" never arrives for a busy person until something breaks. A dashboard you have to reach for gets opened once a day at best — that is, almost never.
An app on the TV works differently — it just glows in the corner of the room. No decision to "go look" is needed; the eye falls on the graph on the way past. That's why stalls should be caught in hours, not days: there's nothing to remember to check — a frozen picture catches the eye on its own.
It isn't an alert system that yanks at you over every little thing, and it isn't a report you have to open and read. More of a background: calm while things go well, and noticeable when they don't.
What's next
Agent autonomy isn't the finish line but the start. The agents can already be trusted with writing code, migrating databases, deploying to servers. But for the system to stay under control without direct intervention, it needs transparency — which is what the whole screen idea is about. The reins are released, but the work still has to be watched. The next step is set: build the dashboard into a native TV app and check whether the graph really does catch stalls in hours, not days.